ESP ZeroCode AI · Community
Temperature Monitoring
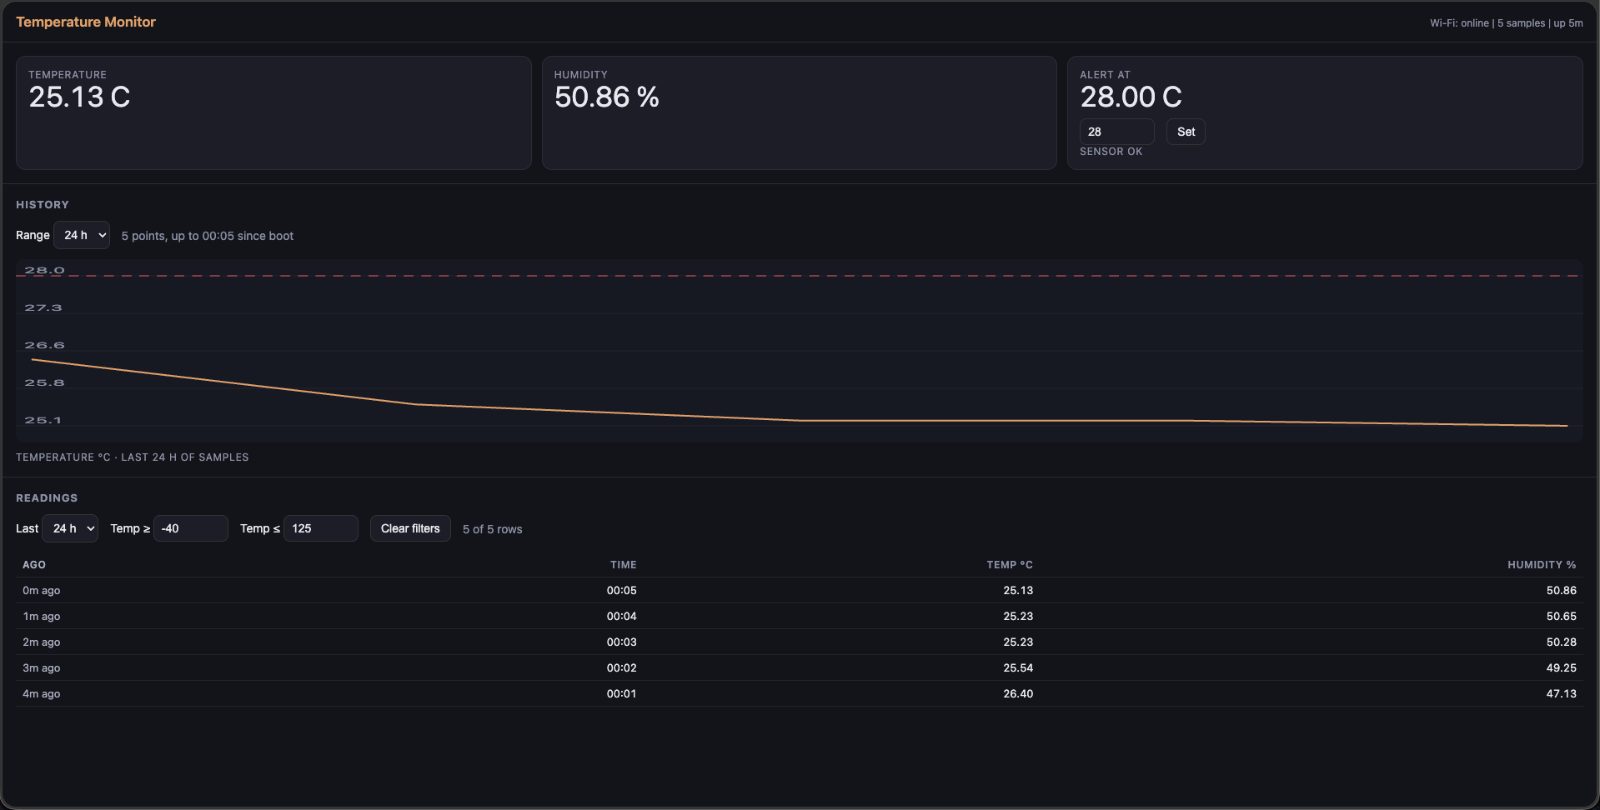
I have a C3 devkit and AHT20 sensor. I want create a temperature monitoring device. I'll see a dashboard where the device is posting the temperature. Maybe some graph of the past 24H too? And also some filtering and sorting of the data.
I am going to keep this device in my office and send a direct alert to the Admin. I keep feeling cold there. Next: I plan to add multiple devices reporting to this same dashboard.— @chiragDownload the firmware Open-source licences Fork it in the studio
What it does
- Temperature and humidity sensing — AHT20 over I2C, sampled continuously
- Web dashboard — the device serves its own page over Wi-Fi (no cloud, no account)
- Live readings — current temperature and humidity shown on the dashboard
- 24-hour history graph — temperature plotted over the last day
- Data table — readings listed with time-range filtering, a temperature threshold filter, and sorting by time, temperature or humidity
- Wi-Fi onboarding — SoftAP setup with mDNS discovery (e.g. http://temperature.local)
- Sampling — one reading every 60 seconds, 1,440 points per 24h window
- History in RAM only — the 24h graph starts empty after a restart or power cut
- On-board RGB LED and BOOT button left unused — the web dashboard is the only feedback
- High-temperature alert — user sets a threshold on the dashboard; an alert is shown on the page while the current temperature is at or above it
Manual
Device Type
A mains/USB-powered Wi-Fi temperature and humidity monitor. An ESP32-C3-DevKitM-1 with an AHT20 sensor serves its own web dashboard — live readings, a 24-hour graph and a filterable table — so the user can watch a room's climate from any browser on the same network, with no cloud account and no hub.
Hardware
chip: esp32c3 — board: esp32-c3-devkitm-1 — gpios: pin: GPIO4 — role: I2C SDA to AHT20 · pin: GPIO5 — role: I2C SCL to AHT20 — peripherals: ASAIR AHT20 temperature + humidity sensor on I2C (address 0x38), powered from 3V3 · ESP32-C3-DevKitM-1 on-board WS2812 RGB LED (GPIO8) — present but intentionally unused · ESP32-C3-DevKitM-1 on-board BOOT button (GPIO9) — present but intentionally unused
Inputs
kind: sensor — label: AHT20 temperature + humidity — hardware: AHT20 over I2C at GPIO4 (SDA) / GPIO5 (SCL), 3V3 — behavior: Polled once every 60 seconds. Each sample is timestamped from the device's uptime and appended to an in-RAM ring buffer holding the most recent 24 hours (1,440 samples). · kind: web — label: Dashboard controls — hardware: The device's own web page, served over Wi-Fi — behavior: The user chooses the graph time range, sets the alert temperature threshold, sets a separate temperature threshold filter on the table, and picks the table's sort column and direction. The alert threshold is stored on the device so it survives a reboot; the view filters are client-side only.
Outputs
kind: display — label: Live readings — hardware: Web dashboard — behavior: Current temperature (°C) and relative humidity (%), refreshed as new samples arrive. · kind: display — label: 24-hour history graph — hardware: Web dashboard — behavior: Temperature plotted against time over the selected window within the last 24 hours. The device streams the buffered samples to the page. · kind: display — label: Data table — hardware: Web dashboard — behavior: One row per stored sample (time, temperature, humidity). Supports a time-range filter, a temperature threshold filter (show only readings at or above a chosen value), and sorting by timestamp, temperature or humidity. · kind: display — label: High-temperature alert — hardware: Web dashboard — behavior: When the latest reading is at or above the user's configured alert threshold, the dashboard shows a prominent alert banner naming the current temperature and the threshold. The banner appears within one sampling interval of the crossing and clears on its own once the temperature falls back below the threshold. It is live state, not a log: nothing is stored, and no alert is raised while no browser is open.
Connectivity
stack: Wi-Fi — transport: 2.4 GHz station (STA), joined to the household network — purpose: Serves the dashboard to any browser on the same LAN. No internet connection and no cloud service are required. · stack: mDNS — transport: Local network name resolution — purpose: Lets the user reach the dashboard at a friendly hostname (e.g. http://temperature.local) instead of an IP address.
Commissioning
method: SoftAP captive setup + mDNS discovery — instructions: On first boot (or after a factory reset) the device broadcasts its own setup Wi-Fi network. The user joins it from a phone or laptop, picks their home network from the list and enters its password. The credentials are stored and the device reboots into station mode. On later boots it rejoins automatically and the dashboard is reachable at the device's mDNS name.
Business Logic
powerOnBehavior: The device boots, reads its stored Wi-Fi credentials and joins the network. If it has never been set up, it raises the setup access point instead. It begins sampling the AHT20 within the first few seconds and starts its web server. Because history is RAM-only, the graph and table are empty on a fresh boot and fill in as samples accumulate over the following hours. The alert threshold is restored from non-volatile storage. — automationRules: High-temperature alert only: when a new sample lands at or above the user's configured alert threshold, the dashboard flags it with an alert banner. There is no buzzer, no notification, and no automatic action on the device — the alert is visible to whoever has the dashboard open. The table's threshold filter is a separate, purely visual filter. — dayToDayOperation: The device sits plugged in and runs unattended. The user opens the dashboard in a browser whenever they want to check the room: the live number is at the top, the 24-hour graph shows the trend, and the table lets them dig into specific readings or filter down to periods above a temperature they care about. The user sets an alert threshold once on the dashboard (kept on the device across reboots); whenever the room goes over it, a banner appears at the top of the page so the condition is obvious at a glance. Nothing needs to be touched on the device itself.
Factory Reset
trigger: Not reachable from the device (its only button is left unused) — re-flashing the firmware with cleared stored credentials is the recovery path. — effect: Stored Wi-Fi credentials are erased and the device returns to the setup access point on the next boot.
Failure Modes
scenario: Wi-Fi unreachable or wrong password at boot — behavior: The device retries rejoining; if it cannot connect it falls back to raising its setup access point so the user can re-enter credentials. Sampling continues in the background so the data buffer keeps filling. · scenario: Wi-Fi drops while running — behavior: Sensing and buffering continue uninterrupted. The web server is simply unreachable until the connection returns; the device reconnects on its own and the dashboard is available again with history intact. · scenario: AHT20 not detected or stops responding on the I2C bus — behavior: The device retries the read and skips that sample rather than logging a bogus value; the dashboard reports the sensor as unavailable instead of showing stale or invalid numbers. · scenario: Power blip or unplanned restart — behavior: The device reboots and rejoins Wi-Fi automatically. The dashboard comes back, the alert threshold is preserved, but the 24-hour history is lost and restarts empty — a deliberate trade-off for keeping the design simple. · scenario: Long uptime with no browser open — behavior: No degradation. The ring buffer simply overwrites samples older than 24 hours, so memory use stays flat. No alert is evaluated or shown while no browser is open.
Custom Behavior
Storage sizing: 1,440 samples of ~12 bytes needs about 18 KB, so the full 24-hour window lives comfortably in RAM and nothing is written to flash — no wear on the flash, at the cost of losing history on restart. The one exception is the alert threshold, which is kept in non-volatile storage so the user doesn't have to re-enter it after every power cut.
Published 15 Oct 2026
Firmware and source licensed Apache-2.0; photos and text CC-BY-4.0.
The firmware includes open-source software — open-source licences and notices; some components may be used only with Espressif chips.
Built with ESP ZeroCode AI — describe a device, get production firmware.
Terms of Service · Privacy Policy